Chest fat is one of the most common trouble spots for men (and sometimes women), and it can feel stubborn no matter how many push-ups you do.
Here's what science actually tells us: you can't spot-reduce fat from just your chest. But that doesn't mean you're stuck with it. With the right combination of diet, exercise, and lifestyle tweaks, you can reduce overall body fat and sculpt a leaner, more defined chest.
This guide will walk you through everything you need to know, from understanding why fat accumulates in your chest to actionable strategies that actually work.
Understanding Chest Fat: Causes and Types
Before you start tackling chest fat, it helps to understand what's going on beneath the surface. Chest fat doesn't show up randomly, it's influenced by genetics, hormones, lifestyle, and sometimes underlying health conditions. Knowing the root cause can help you choose the most effective approach.
Why Fat Accumulates in the Chest Area?
Your body stores fat in different places based on factors you can't fully control.
Genetics play a huge role, some people naturally store more fat in their chest, belly, or thighs.Some research suggests genetics can influence where the body tends to store fat. Genome-wide association studies have pinpointed over 460 genetic locations related to how and where your body stores fat, with some people naturally storing more in their chest, while others accumulate it in their belly or thighs.
Hormones are another major player. Higher levels of estrogen relative to testosterone can encourage fat storage in the chest, particularly in men. This hormonal imbalance might result from aging, obesity, certain medications, or health conditions.
Beyond that, lifestyle habits matter. A diet high in processed foods, sugar, and unhealthy fats can lead to overall weight gain, and your chest might be one of the places where that extra fat shows up.
Lack of physical activity compounds the issue, as your body burns fewer calories and loses muscle mass over time.
What Causes Chest Fat in Males?
For men specifically, chest fat often ties back to testosterone levels. As you age, testosterone naturally declines while estrogen can increase, especially if you're carrying excess body fat, since fat tissue can convert testosterone into estrogen. This creates a feedback loop: more fat leads to more estrogen, which encourages more fat storage in the chest.
Primary causes of male chest fat:
Obesity and being overweight are the most straightforward causes. When your calorie intake exceeds what you burn, your body stores the surplus as fat. The chest is a common depot, particularly if you're genetically predisposed to store fat there.
Alcohol consumption, especially heavy drinking, can also interfere with hormone balance and contribute to chest fat accumulation.
Certain medications, like steroids, anti-androgens, or treatments for prostate conditions, can affect hormone levels and lead to increased chest fat. If you've recently started a new medication and noticed changes, it's worth discussing with your doctor.
Chest Fat vs. Gynecomastia
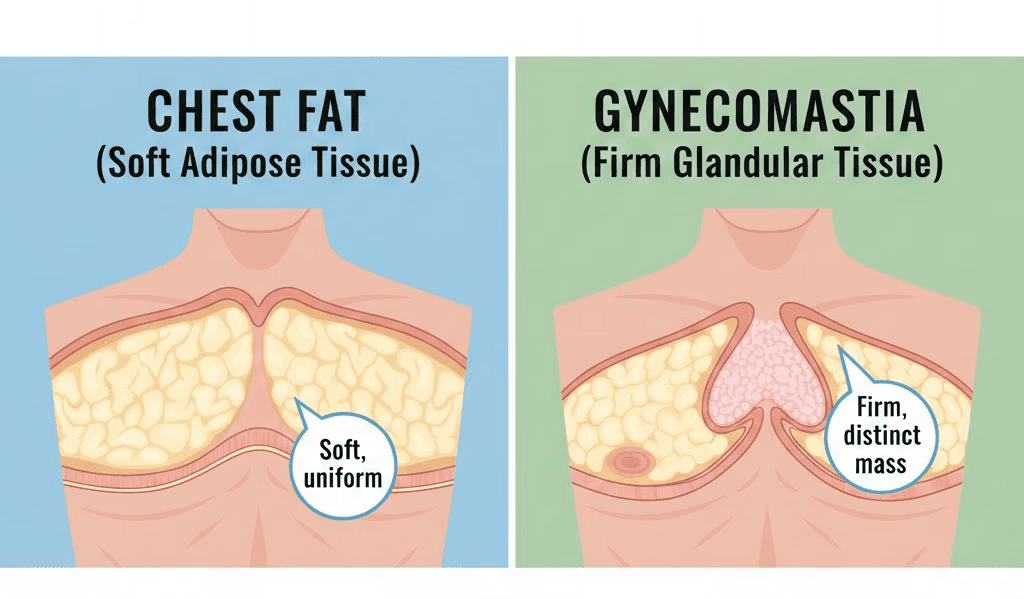
Not all chest enlargement is the same:
Chest fat is exactly what it sounds like: adipose tissue stored in the pectoral area. It's soft, and you can pinch it between your fingers.
Gynecomastia, on the other hand, is the development of actual glandular breast tissue in men. It feels firmer, sometimes rubbery, and is usually centered around the nipple.
Gynecomastia is caused by hormonal imbalances, often an excess of estrogen or a deficiency in testosterone. It can occur during puberty, in older age, or due to medications, health conditions (like liver or kidney disease), or substance use. Unlike chest fat, which responds to diet and exercise, gynecomastia often requires medical treatment or surgery to correct.
Approximately 65% of men between ages 50-80 experience gynecomastia, while 50-60% of adolescent boys develop it during puberty (though 75% of those cases resolve within two years). For adults with persistent gynecomastia, 25% of cases are idiopathic, meaning no specific cause can be identified.
Chest fullness can come from fat tissue, glandular tissue (gynecomastia), or a combination of both. Because it can be hard to tell the difference on your own, consider talking with a healthcare professional if you notice persistent changes, pain, a firm lump, or nipple discharge.
Feature | Chest Fat | Gynecomastia |
Tissue type | Fat (adipose tissue) | Glandular breast tissue |
Texture | Soft, squishy | Firm or rubbery |
Pinch test | Easily pinched between fingers | Feels like a disc or lump under the nipple |
Location | Spread across the chest | Usually centered behind the nipple |
Main cause | Overall body fat gain | Hormonal imbalance (estrogen/testosterone) |
Common triggers | Diet, inactivity, weight gain | Puberty, aging, medications, health conditions |
Response to diet & exercise | Yes | Usually no |
Need for medical treatment | No | Often yes |
Typical solutions | Fat loss, strength training | Medical evaluation, hormone treatment, or surgery |
How to Get Rid of Chest Fat: Evidence-Based Strategies
Now for the strategies that work. Remember, you can't target fat loss in just one area. But by reducing your overall body fat percentage through diet, exercise, and smart lifestyle choices, you'll eventually see results:
The Role of Diet in Reducing Chest Fat

You can't out-exercise a bad diet. If you're serious about losing chest fat, your eating habits need attention first. In general, fat loss occurs when energy intake is lower than energy expenditure over time. That typically involves an overall pattern where intake is lower than what the body uses.
But it's not just about calories. The quality of your food matters, too. Diets high in refined carbs and sugar can spike insulin levels, which encourages fat storage. Many people find that prioritizing minimally processed, nutrient-dense foods can support satiety and overall nutrition during weight loss. According to clinical studies on weight loss, this deficit should result in 0.5-1 kg of weight loss weekly.
Focus on:
Lean proteins (chicken breast, turkey, fish, tofu)
Vegetables (especially leafy greens and cruciferous veggies)
Whole grains (oats, brown rice, whole wheat)
Healthy fats (avocado, nuts, olive oil)
Fruits in moderation (berries are great for antioxidants)
Plenty of water (often overlooked but crucial)
Some people choose to reduce:
Sugary drinks and sodas (empty calories that spike insulin)
Processed snacks and fast food (high in trans fats and sodium)
Alcohol (it disrupts hormone balance and adds calories)
Refined carbs (white bread, pastries, sugary cereals)
Fried foods (loaded with unhealthy fats)
Consistency beats perfection. You don't need to eat perfectly 100% of the time, but your overall pattern should lean toward nutrient-rich, whole foods most days.
Effective Exercises to Target the Chest
Exercise is the second pillar. While you can't spot-reduce fat, you can build muscle in your chest to create a firmer, more defined appearance as you lose fat overall. A combination of strength training and cardio will give you the best results.
Strength Training Exercises for Chest Definition
Building your pectoral muscles won't directly burn the fat sitting on top, but it will improve the shape and appearance of your chest. Plus, muscle tissue burns more calories at rest than fat does, so increasing your muscle mass boosts your metabolism.
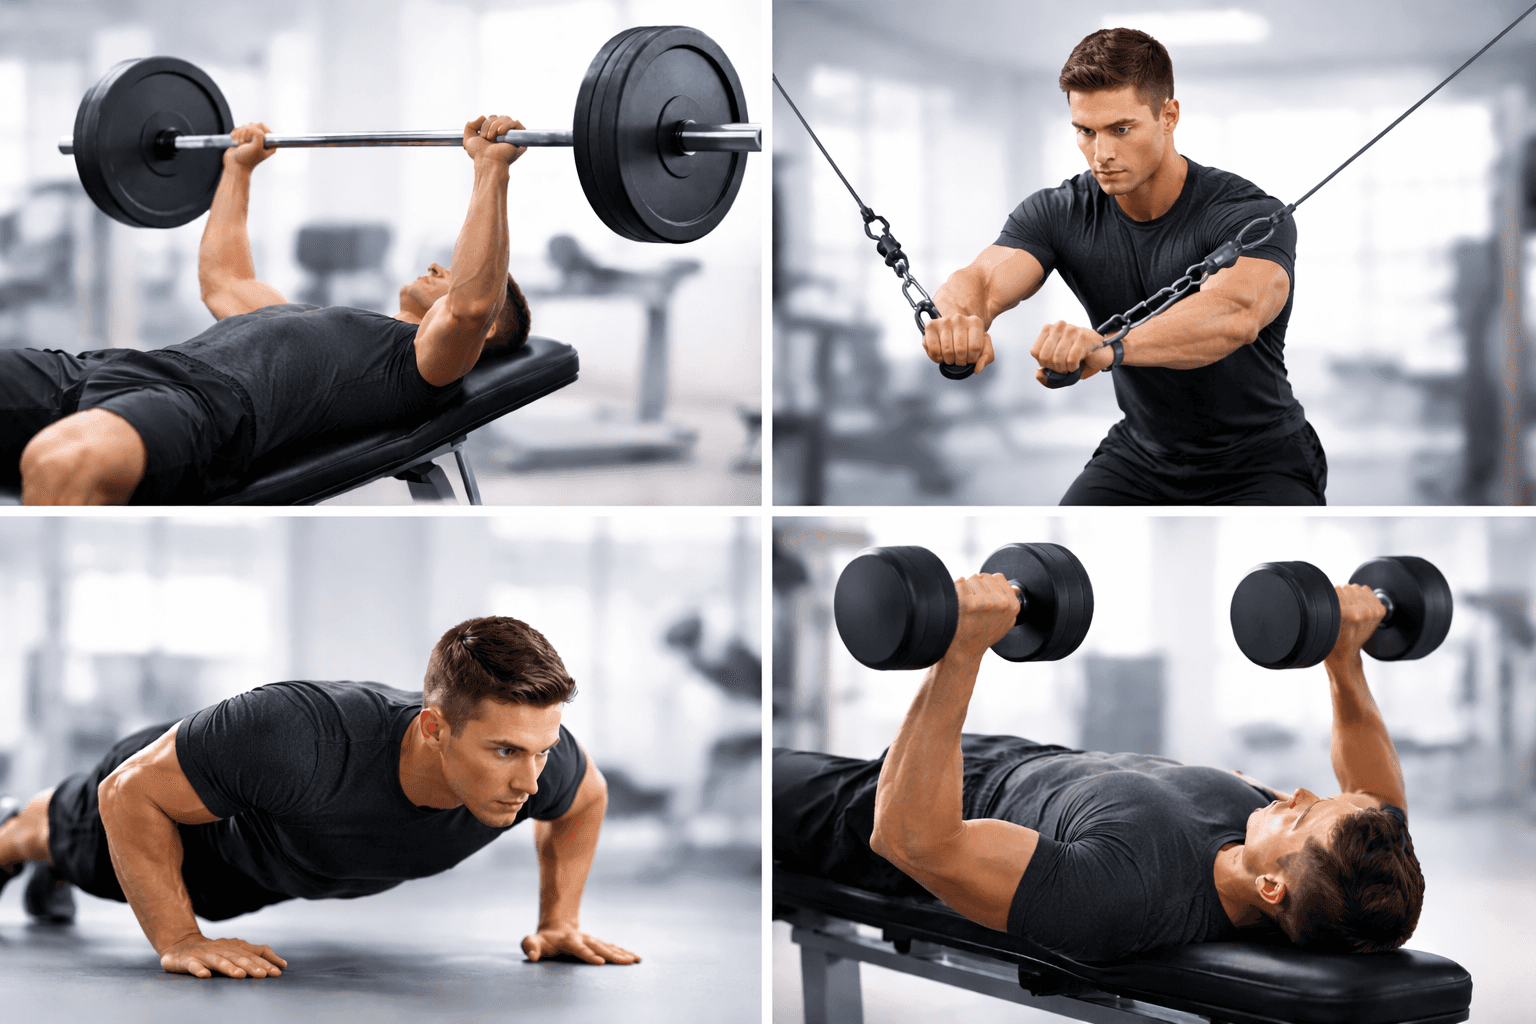
Here are some of the most effective chest exercises:
Push-ups: The classic. They work your entire chest, shoulders, and triceps.Different push-up variations can shift which muscles feel most challenged.
Bench press: A staple for building chest mass and strength. Bench press can be performed with different equipment and angles depending on experience and access.
Dumbbell flyes: Great for stretching and contracting the pectoral muscles. Go slow and controlled.
Dips: Targets the lower chest and triceps. Lean forward slightly to emphasize the chest.
Cable crossovers: Excellent for isolating the chest and achieving a good squeeze at the peak contraction.
Many programs include regular chest-focused strength work, and sets, reps, and load can be adjusted to goals, experience, and recovery. Don't neglect other muscle groups, balanced training supports overall fat loss and prevents injury.
Cardio Workouts for Overall Fat Reduction
Cardio can increase energy expenditure and support fat loss, especially when combined with nutrition and strength training. You don't need to run marathons, consistent, moderate-intensity cardio combined with some high-intensity intervals works well.
Steady-state cardio: Moderate-intensity activities like jogging, cycling, swimming, or brisk walking can support overall activity levels, and the amount can be adapted to your schedule and fitness level.
High-Intensity Interval Training (HIIT): Short bursts of intense effort followed by rest periods. HIIT can be a time-efficient way to increase effort, and some people experience a short-term increase in post-exercise energy expenditure. Think sprints, jump rope, or circuit training.
Incline walking: If high-impact exercise isn't your thing, walking on an incline is surprisingly effective for fat loss and easier on your joints.
The best cardio is the one you'll actually do. Pick something you enjoy, or mix it up to keep things interesting!
Lifestyle Changes That Support Chest Fat Loss

Diet and exercise are critical, but your daily habits can either accelerate or sabotage your progress. Here are some lifestyle factors that often get overlooked:
Sleep: Poor sleep messes with hunger hormones (ghrelin and leptin), increases cravings, and lowers testosterone. Many health organizations recommend adequate sleep, and individual needs can vary.
Stress management: Chronic stress elevates cortisol, a hormone that promotes fat storage, especially around the midsection and chest. Some people find practices like meditation, breathing exercises, or yoga helpful for stress management
Limit alcohol: Alcohol is high in empty calories and can lower testosterone while raising estrogen. Cutting back can make a noticeable difference.
Stay hydrated: Water supports metabolism, helps control appetite, and keeps your workouts effective. Hydration needs vary with activity level, climate, and individual factors.
Be patient and consistent: Fat loss takes time, and chest fat might be one of the last areas to lean out. Sustainable progress often takes time, and consistency over weeks can matter more than day-to-day fluctuations. Track your progress with photos and measurements, not just the scale.
When to Consider Medical Evaluation?
Sometimes, chest fat isn't just about diet and exercise. If you've been following a solid plan for several months without seeing any improvement, or if your chest has a firm, glandular feel rather than soft fat, it's time to talk to a doctor.
As mentioned earlier, gynecomastia involves actual breast tissue growth and won't respond to lifestyle changes alone. A healthcare professional can evaluate symptoms and may recommend lab work based on your history and exam. Imbalances in any of these can contribute to chest fat or gynecomastia.
If gynecomastia is diagnosed, a clinician can discuss management options based on the cause and severity.
Don't ignore persistent or worsening chest enlargement, especially if it's accompanied by pain, nipple discharge, or lumps. While rare, these can be signs of more serious conditions that need prompt evaluation.
Key Takeaways
Spot-reducing chest fat is impossible, but you can lose chest fat by reducing overall body fat through a calorie deficit, proper nutrition, and consistent exercise.
Combine strength training exercises like push-ups, bench press, and dumbbell flyes with cardio workouts to build chest muscle and burn fat effectively.
Prioritize a diet rich in lean protein, healthy fats, and whole grains while avoiding sugary drinks, processed foods, and excess alcohol to support fat loss.
Lifestyle factors like getting 7-9 hours of sleep, managing stress, and staying hydrated play a crucial role in reducing chest fat and balancing hormones.
If chest enlargement feels firm rather than soft or doesn't improve after months of effort, consult a doctor to rule out gynecomastia or hormonal imbalances.
Bottom Line
Losing chest fat isn't about doing a hundred push-ups a day or cutting out all carbs. It's about creating a sustainable calorie deficit through smart eating, combining strength training with cardio, and supporting your efforts with healthy lifestyle habits. You can't spot-reduce fat, but you can reduce your overall body fat percentage, and eventually, your chest will follow.
Be patient with yourself. Results won't happen overnight, and chest fat is often one of the last areas to slim down. Track your progress with measurements and photos, not just the scale. If you want a more objective way to monitor body fat changes, tools like InBody scans can help you see shifts in fat mass and lean tissue over time.


